Nearly 40% of US counties see MMR rates fall over 5 points since 2019
New data mapping kindergarten vaccination trends across thousands of counties reveals a sharp and widespread decline in measles, mumps, and rubella immunization coverage.
By Ahmed Russo ·
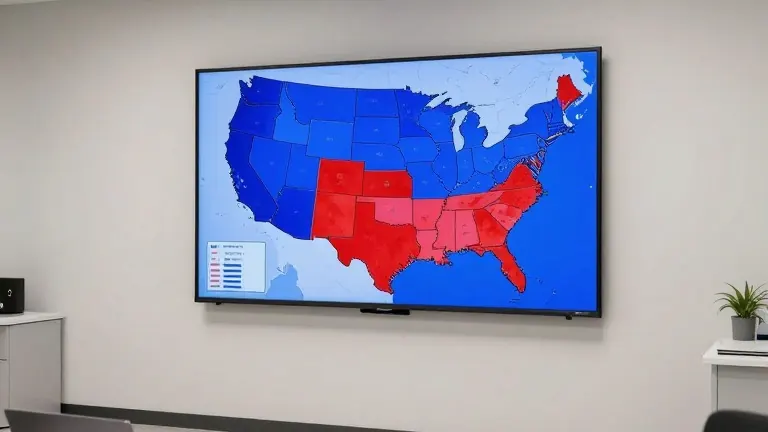
Researchers from Stanford University and data teams from NBC News have mapped a distinct downward trend in childhood vaccination rates across the United States. The new analysis, released in November 2026, tracks kindergarten immunization data for the 2025-2026 academic year. It serves as an update to a previous investigation published in September 2025. The primary goal of the study is to quantify how many local communities are seeing fewer children fully vaccinated.
The data shows that almost four in ten counties in the country have experienced a drop of more than five percentage points in MMR vaccination rates since 2019. Approximately one in eight counties has seen a decline of that magnitude since 2024. In contrast, fewer than 2% of counties registered a decrease of 0.1 percentage points or less over the same seven-year period. The findings indicate that the decline is not limited to a few isolated areas but is a widespread phenomenon.
The study focuses specifically on the measles, mumps, and rubella vaccine. For states that track doses separately, the analysis counts the second dose of the MMR series. In states where the three viruses are tracked individually, the data uses measles immunization rates to represent overall MMR coverage. This standardization allows for a consistent comparison across different state reporting systems.
NBC News assembled the database by collecting records from state health agencies and public archives. The team filed numerous requests for documents, including materials obtained through the Freedom of Information Act. They combined publicly available information with data provided directly by state officials. The process required extensive work to standardize the format of data coming from thousands of different jurisdictions.
Some states required specific calculations to aggregate their data. For example, Ohio and New York needed further processing to combine state-supplied figures. Other states required the manual entry of hundreds of rows of tabular data. The team checked all entries for accuracy to manage inconsistencies in how different regions collect and report health information.
The analysis also examined the scale of the decline by looking at exemption rates. Medical exemptions are granted when a student has a condition that makes vaccination potentially harmful. Nonmedical exemptions cover students who opt out based on personal beliefs or religious convictions. The study tracks the percentage of kindergarteners who are considered up to date, meaning they have received the full series of vaccines required for school enrollment.
Variations in state reporting practices created challenges for the data collection. Some states use health districts rather than counties for their reporting. Others provided data spanning more than a decade, while others supplied only two years of records. Certain states redacted specific data points due to privacy concerns. Florida did not provide data on kindergarten exemptions after the 2021-2022 school year. Montana stopped collecting vaccine and exemption data after 2019, a decision influenced by a 2021 state bill that removed the mandate for data collection.
Other states, such as Arizona and Minnesota, do not collect an overall up-to-date figure for all required vaccines. Florida, New Hampshire, and South Carolina provided only up-to-date numbers without the full breakdown. Mississippi, New Hampshire, and South Carolina provided data for grades K-12 rather than specifically for kindergarteners. West Virginia provided exemption data per county starting in January 2025, but did not have county-level immunization data for the same period.
Alaska and Nebraska provided data for jurisdictions other than counties, while Delaware and Rhode Island used state-level figures because county data was unavailable. Indiana could not provide county-level exemption data. Wyoming used data for children aged 19 to 35 months instead of kindergarteners to ensure consistency in reporting. The variant analyses conducted to test the robustness of the results yielded similar findings, with most variations remaining within one percentage point.
The new data was collected between June and October 2026. The methodology mirrors the approach used in the 2025 investigation, ensuring that the trends observed are consistent with prior findings. The focus remains on kindergarten students, as this is the standard entry point for school vaccination requirements. The data provides a detailed look at how local vaccination rates have shifted in the years following the peak of pandemic-related disruptions.